
A solid platform with unique business model
- Leading market positions – 7th largest in the US1 and 2nd largest in MENA2
- Expanding manufacturing footprint - 29 plants across our markets, with additional facilities being established
- Global player with local expertise
- Trusted partner known for our commitment to quality and reliability of supply
- Agile supply chain, flexible manufacturing and leading technical capabilities
Highlights
An increasingly diverse portfolio and pipeline
- A broad portfolio that is tailored to local market needs
- Targeting increase in R&D spend to 6–7% of Group revenue to ensure the consistent development of new products
- Growing presence in specialty, complex and higher-value products, which offer less competition and higher margins
- Strong momentum in new product launches across our markets
- Enhancing our pipeline by adding innovative products through value-creating partnerships
- Adding to the strength of our base business through strategic acquisitions
Highlights
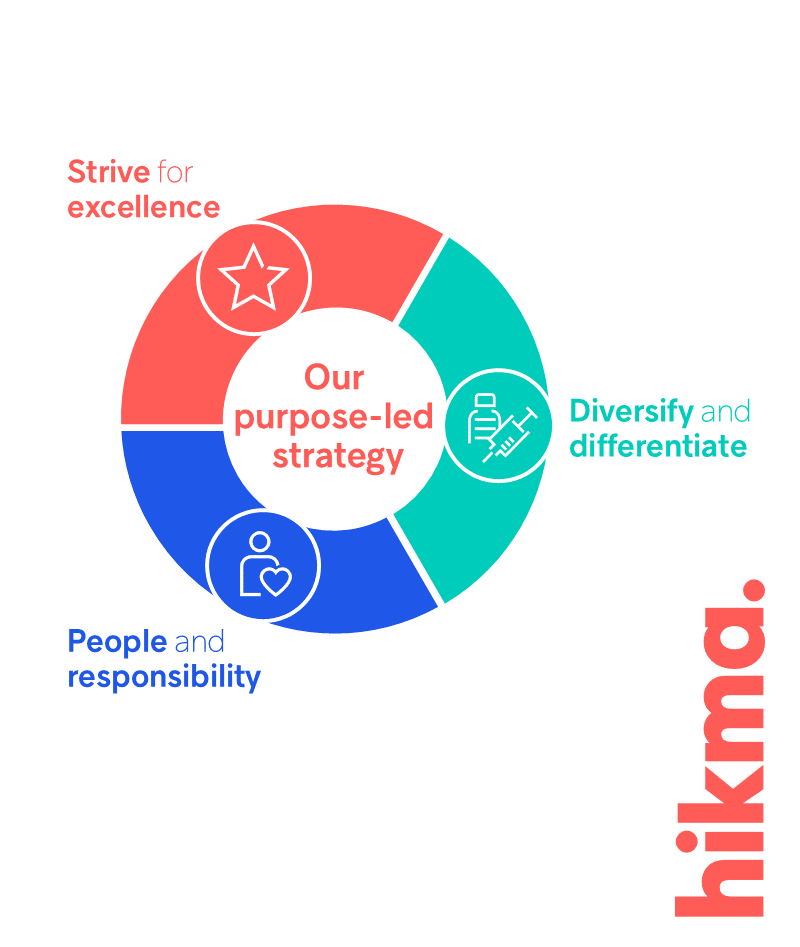
Strategic execution driven by our three pillars
A proven track record of delivery for shareholders
- Group revenue compound annual growth rate (CAGR) of 7% and core EBIT CAGR of 7% since 2019
- Strong cash generation with $564 million operating cash flow in 2024
- Strong balance sheet that provides financial flexibility to support future growth, with low leverage of 1.4x net debt to EBITDA
- High returns, with 16.9% return on average invested capital
Highlights
All figures for year ending 31 December 2024.
Latest news

Featured
Hikma delivers a solid H1 performance and re-affirms expectations for strong growth in the second half
Press Release, Financial Results
07 August 2025
- Hikma and Richter receive FDA approval for denosumab biosimilars EnobyTM (denosumab- qbde) and XtrenboTM (denosumab- qbde) referencing Prolia® and Xgeva® respectively Press Release, Product 29 September 2025 Hikma and Richter receive FDA approval for denosumab biosimilars EnobyTM (denosumab- qbde) and XtrenboTM (denosumab- qbde) referencing Prolia® and Xgeva® respectively
- Hikma delivers a solid H1 performance and re-affirms expectations for strong growth in the second half Press Release, Financial Results 07 August 2025 Hikma delivers a solid H1 performance and re-affirms expectations for strong growth in the second half
- Hikma remains a constituent of the FTSE4Good Index Press Release, Corporate 16 July 2025 Hikma remains a constituent of the FTSE4Good Index
- Hikma launches Morphine Sulfate Injection, USP, in a prefilled syringe in the US Press Release, Product 14 July 2025 Hikma launches Morphine Sulfate Injection, USP, in a prefilled syringe in the US
Related content
Recent results
1. IQVIA MAT December 2024, includes all generic injectable and non-injectables
2. Based on internal analysis by using data from the following source: IQVIA MIDAS® Monthly Value Sales data for Algeria, Egypt, Jordan, Kuwait, Lebanon, Morocco, Saudi Arabia, Tunisia and UAE, for the period: calendar year 2024, reflecting estimates of real-world activity. Copyright IQVIA. All rights reserved.